Practice 4: Analyzing & Interpreting Data
|
> After data has been collected, it must be analyzed in order to:
|
Possible Sources of Data |
|
How To Gather Data
Science JournalsScience notebooks and journals may contain drawings, measurements,
numbers, words, and observations. |

|
Guidelines for ChartsTables allow organization and summary of data. A data table should be planned before the investigation starts. Consider the following:
|
|
Graphing Data> Graphs can be used to visually summarize and make data accessible. > Graphs are visuals used to compare data. > Graphs show not only information but also relationships between the data. > Different types of graphs show different types of information. |
|
>> Use the Graphing Skills Gizmo from www.explorelearning.com to review & practice the basic components of each type of graph.<<
Citation: ExploreLearning Gizmos, Graphing Skills. © ExploreLearning.
Defining Variables
|
|
> Variables are factors that can affect the results of an experiment. Before an investigation begins, the variables that could affect the results must be identified. > It should then be determined which one variable to change or test and which conditions should be kept the same in the experiment. |
- Independent (Manipulated) Variable - The variable that is being tested as the possible cause of the outcome that is being measured.
- Dependent (Responding) Variable - The variable that is being measured as the results from the changes made to the independent variable (this making it dependent upon the other).
Challenges of Data Collection & AnalysisYou should be able to explain why results might be different even though the same investigation testing the same factors was being done by several groups. Investigations may yield varying results based on the following factors:
|
|
Jedi Masters of this Practice Can... |
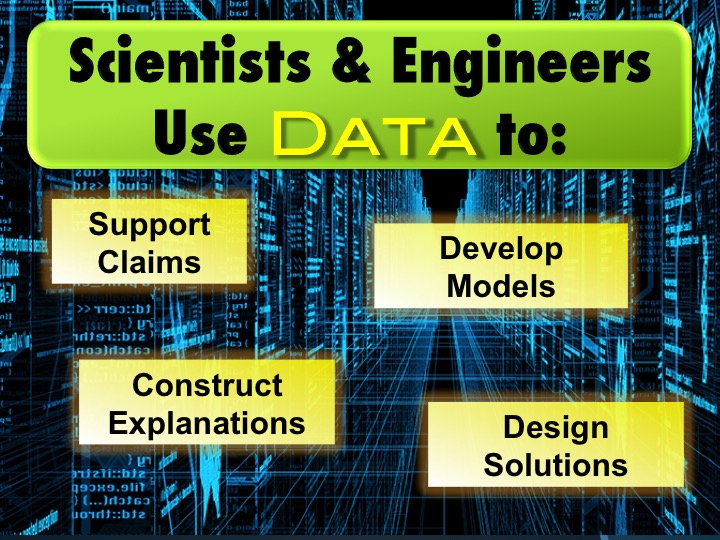
> Use data as evidence to do the following:
- support reasoning - support a claim - construction an explanation - evaluate a design or solution > Identify trends, patterns, and relationships within a data set. > Distinguish between causation and correlation > Use statistical practices in analyzing data. > Appropriately organize and represent data. > Determine whether or not the data supports predicted outcomes. |
